Using Python (OpenCV) to analyze video files
1. Excerpt
I have collected video recordings from a rat that was performing multiple trials of reach-and-pull activities. My goal in this project is to classify these activities based on the number of reaches rat performed in each trial. The overall procedure looks like this:
2. Introduction
Rodents are among the most popular animal models used in research studies. Rats, especially, can be trained to perform a variety of tasks to study motor disabilities, and psychological and cognitive disorders. When analyzing the rat behavior or using it as a dependent parameter, it is often required to use repetitive trials in which the rat performs a “similar” task. (A trial is defined as the learned task, such as reaching and grasping a food pellet, that is performed by rat over and over again and during which data is collected). Perhaps, the best method of identifying a particular task is to use a 3D tracking system with reflective markers attached to the rat’s joints, although such systems can be very expensive. A cheaper and equally effective method might be using a simple USB camera that is strategically placed so that it can capture information from the images.
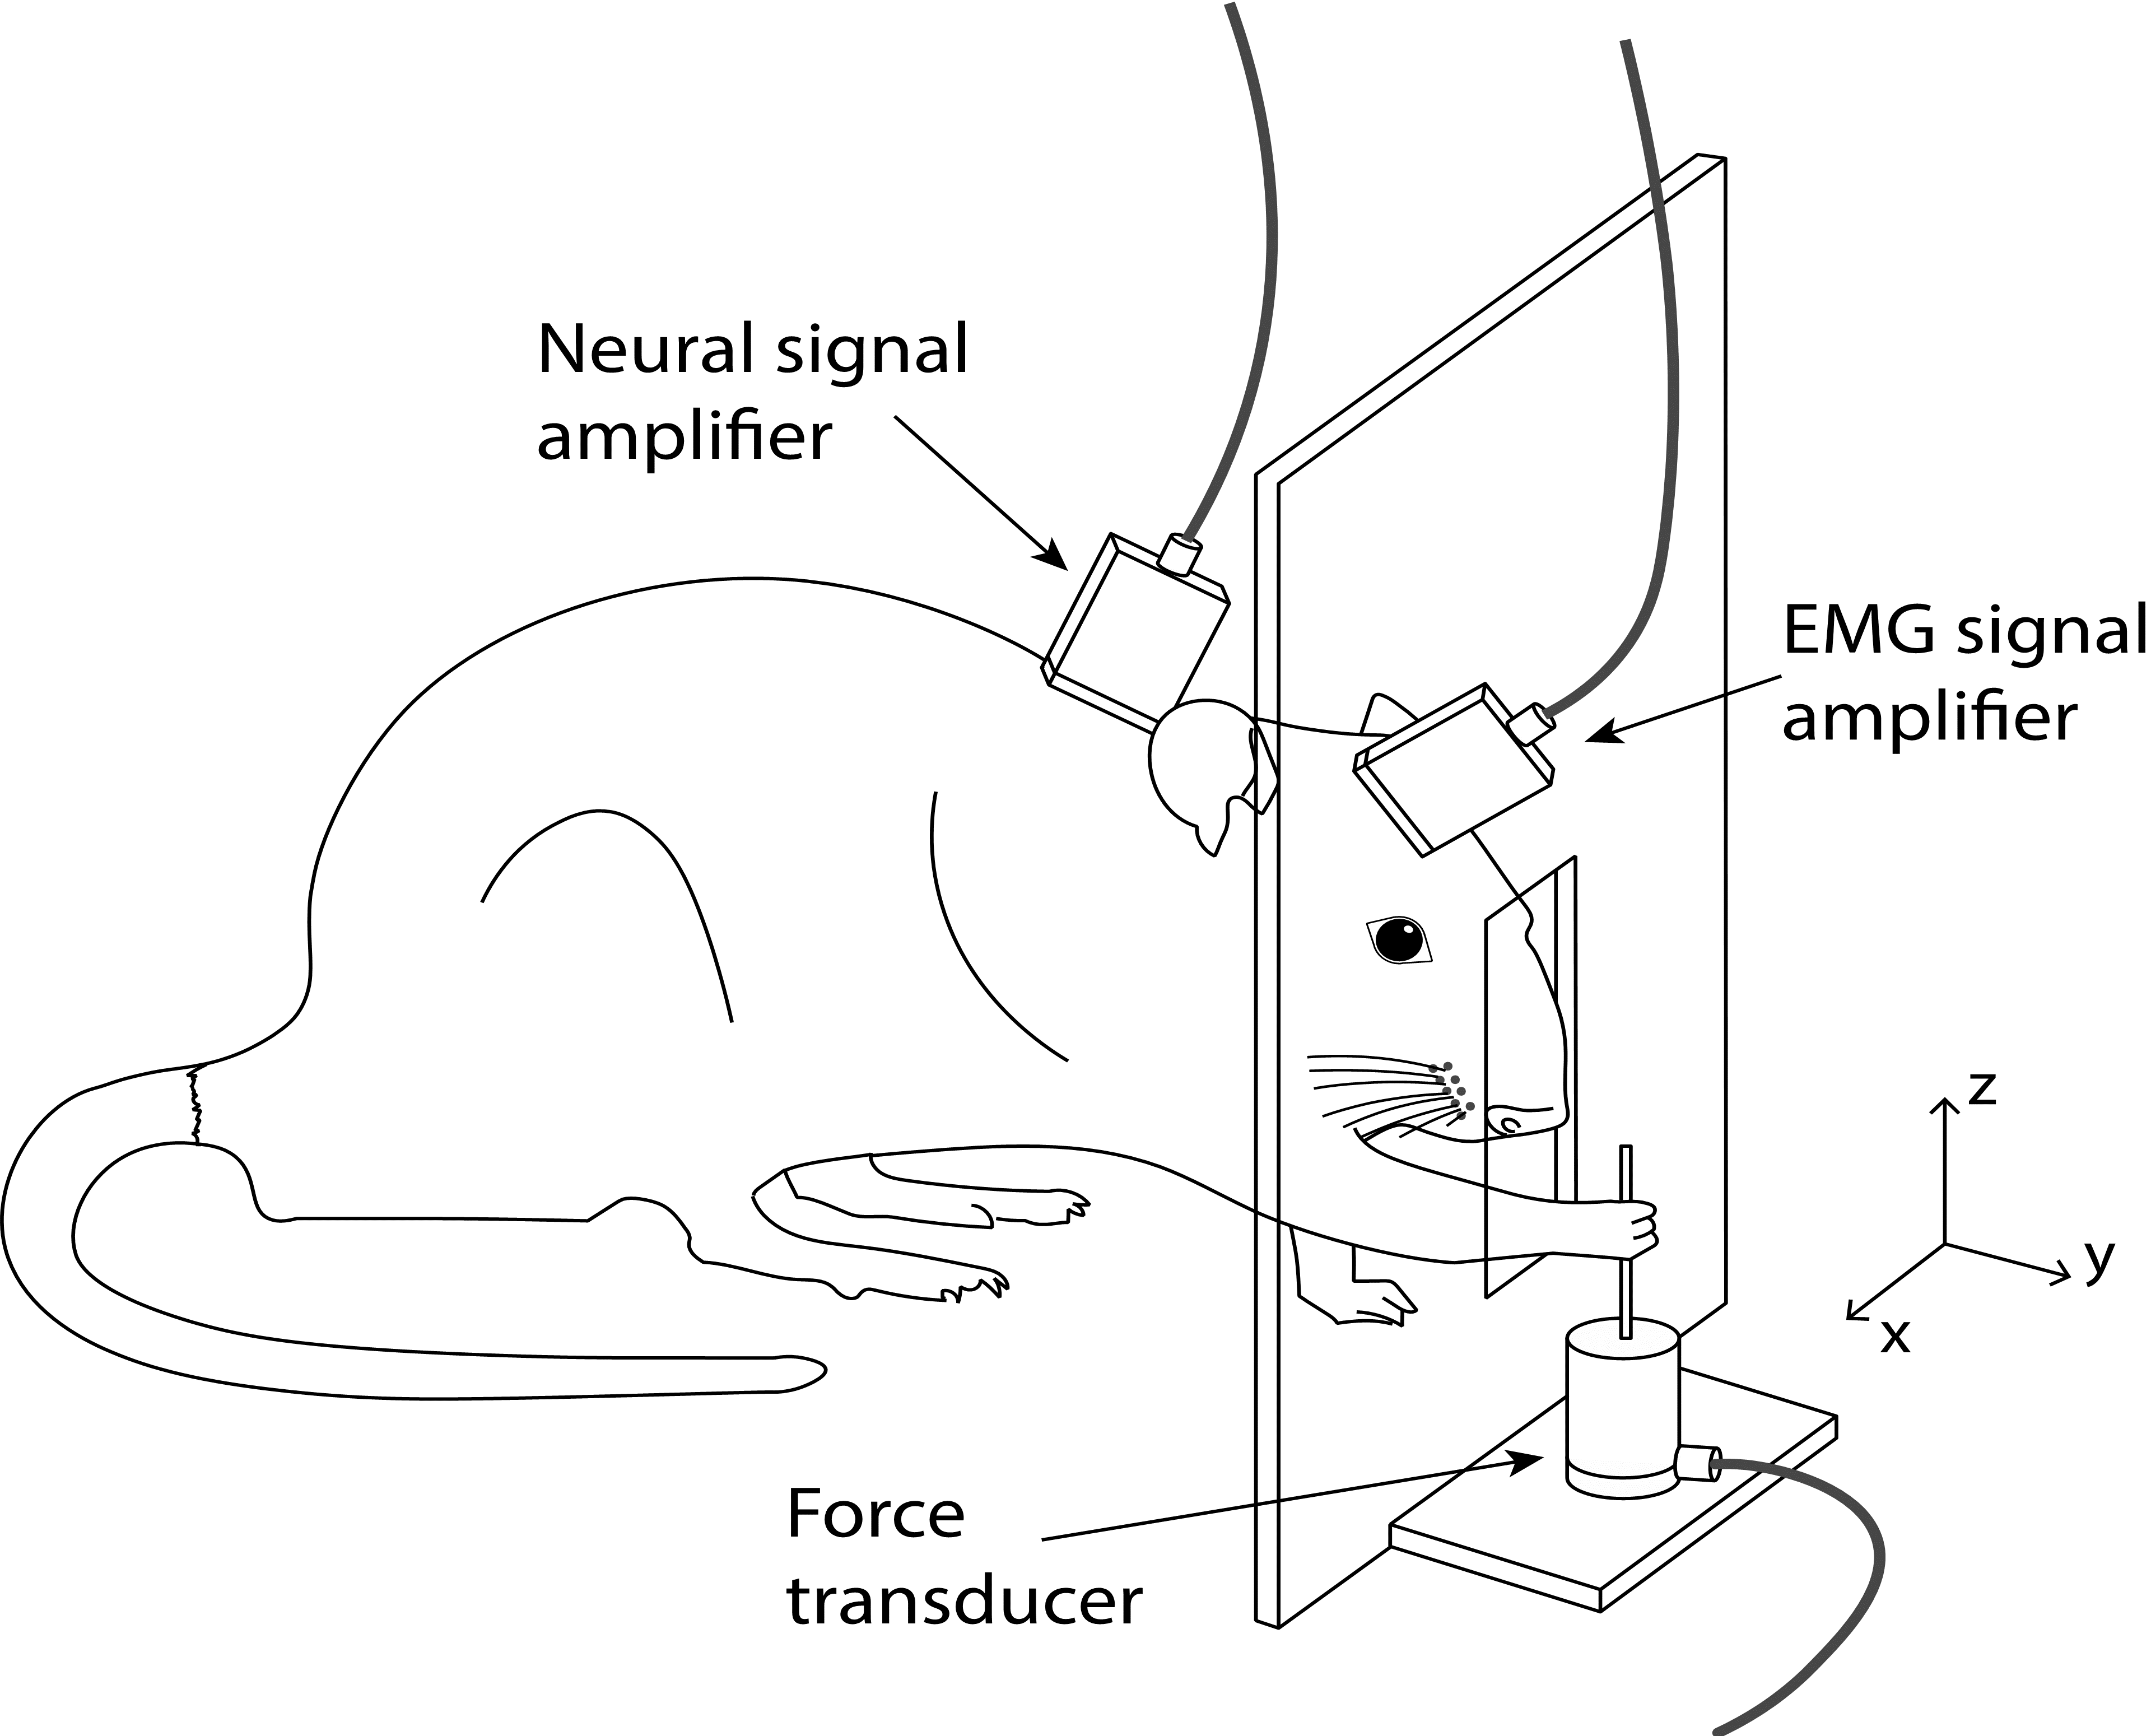
Figure 1. The behavioral task
3. Problem Definition
The picture above demonstrates an experimental setup where neural, EMG, and force signals are being recorded simultaneously while the rat is performing a reach-to-pull task. In this task, the rat reaches through a window on its cage and pulls on a metal rod. The recording system automatically saves all the signals along with video images sampled at 30 frames/sec. Our goal is to group trials based on the number of reaches the rat performs, so that we can study each group separately.
What about using a force sensor?
Using a force sensor is probably the first and simplest solution we can think of. However, there it has a big drawback. We can detect reaches only if the animal makes contact with the rod. All other reaches would go unnoticed. We need a better approach where we can detect the reaches regardless of the final outcome (pulling vs. not pulling).
What is the alternative?
We can analyze the video recordings to figure out how many times rat attempted the pull in a given trial.
4. Image Processing using OpenCV-Python
Here is the basic flowchart that I implemented:
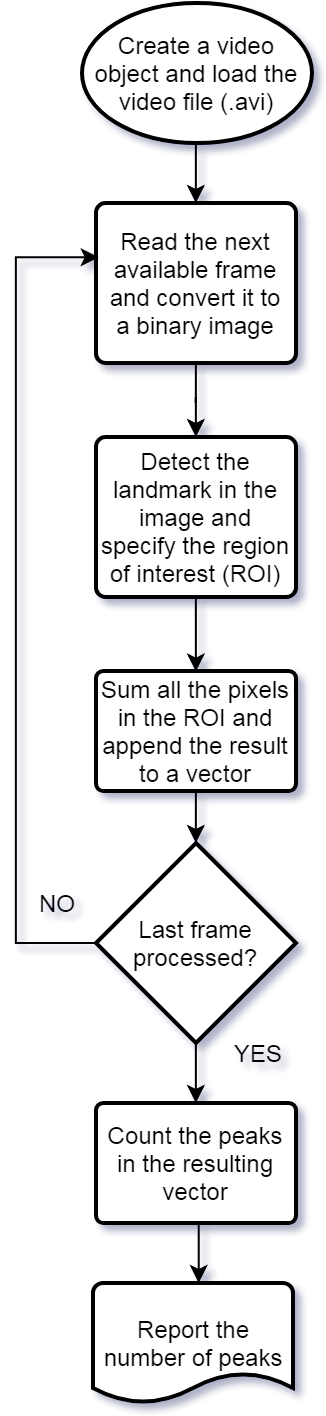
Figure 2. The flowchart
Step 1: Read the frames, convert it to gray scale, and specify the Region of Interest (ROI)
# Convert from colored to grayscale
gray = cv2.cvtColor(frame, cv2.COLOR_BGR2GRAY)

# Define a region of interest for the white plastic tray (landmark)
roi = np.zeros((480,640), np.uint8)
roi[240:400, 220:460] = np.ones((160,240), np.uint8) * 255
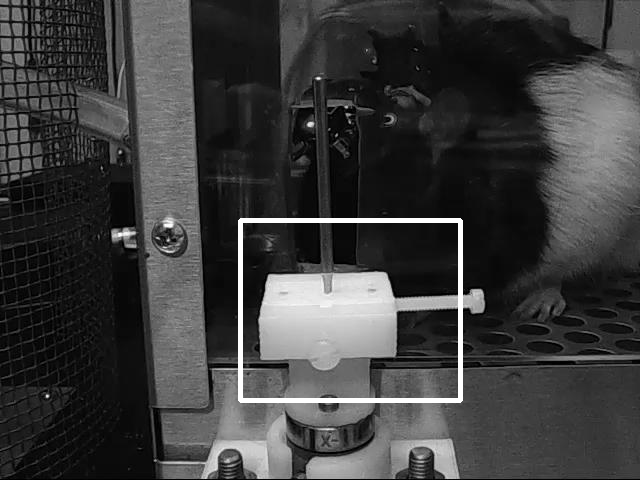
Figure 3. ROI is shown as the white rectangle
Step 2: Convert frame to a binary image
# Convert from grayscale to black-and-white
_, thresh = cv2.threshold(gray, 125, 255, cv2.THRESH_BINARY)

# Bitwise-AND the mask and the original image
res = cv2.bitwise_and(thresh, thresh, mask=roi)
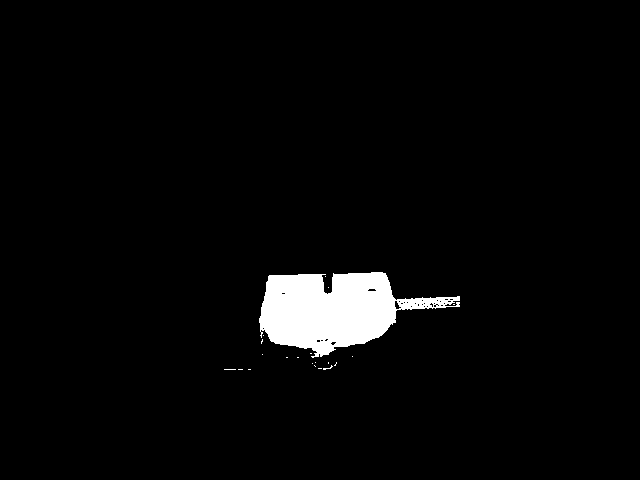
Figure 4. Binarized
Step 3: Use cv2.findContours() to find the desired large white area and mark it
contours, hier = cv2.findContours(res,cv2.RETR_LIST,cv2.CHAIN_APPROX_SIMPLE)
for cnt in contours:
    if 5000 < cv2.contourArea(cnt) < 20000:
        cv2.drawContours(frame, [cnt], 0, (0, 255, 0), 2)
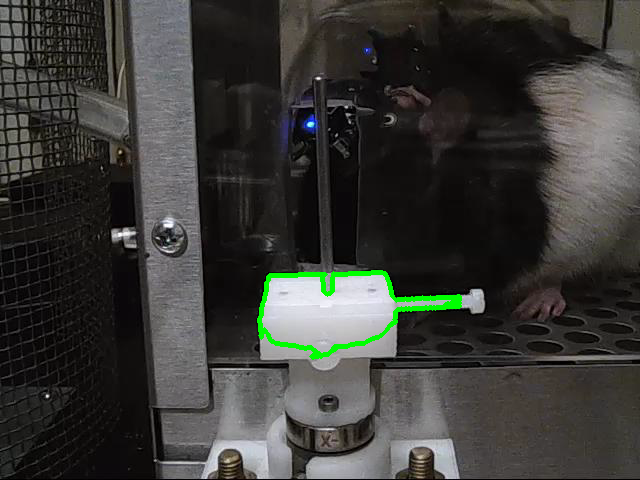
Figure 5. Contour idntified
Step 4: Finally, choose a window of interest to follow rat’s paw movements
# x1, y1, x2, and y2 coordinates are defined based on the contour
img = cv2.rectangle(frame, (x1, y1), (x2, y2), (0, 0, 255), 3)
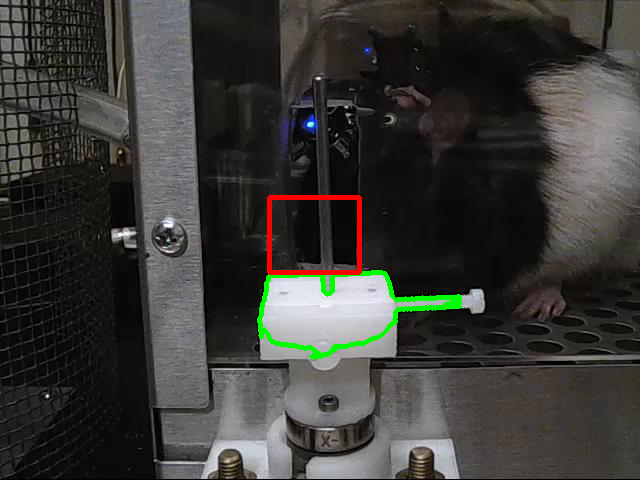
Figure 6. We are interested in the pixel variations within the RED area
Let’s look at the overall procedure one more time:
5. Testing the Algorithm
I tested the algorithm on two sessions of recordings, each having about 100 trials. The confusion matrices and kappa statistics are given below. The group numbers represent the number of reaches with or without a successful pull. Actual numbers of reaches were determined by a human observer.
1: One reach, 2: Two reaches, 3: Three reaches, 4: Four reaches
RESULTS
	SESSION 1:

		   		Predicted group
			      1	  2   3   4  | Tot.
			  -------------------------
			  1 | 20  2   1	  0  | 23		-Accuracy = 90%
		 Actual	  2 | 1	  41  3   1  | 46		-Cohen's kappa = 0.8341
	 	 Group	  3 | 0   1   16  0  | 17		-Near perfect agreement between groups
			  4 | 0   0   0   1  | 1
			  -------------------------
			Tot.| 21  44  20  2  | 87


	SESSION 2:

		   		Predicted group
			      1	  2   3   4  | Tot.
			  -------------------------
			  1 | 34  3   0	  0  | 37		-Accuracy = 85%
		 Actual	  2 | 5	  49  2   0  | 56		-Cohen's kappa = 0.7440
	 	 Group	  3 | 1   4   8   0  | 13		-Substantial agreement between groups
			  4 | 0   0   1   0  | 1
			  -------------------------
			Tot.| 40  56  11  0  | 107
6. Conclusion
By analyzing video images, I segregated rat’s reaching movements into different groups with significant accuracy. There were two major limitations in the method I used:
- Paw detection is susceptible to changes in the background. The background must be dark and static in order for this method to work efficiently. A better approach would be placing the camera from a bird-view angle so that rat’s body would not intervene with the ROI window.
- The current method requires a pre-defined region to focus (the ROI) which requires user adjustments based on camera angle. An optimal approach should automatically decide an ROI without requiring the user’s involvement.
7. Demo
Instructions for using the demo folder in a Python IDE (E.g. VS Code)
- Download the files
$ git clone https://github.com/goksinan/rat_video_demo.git - Go to rat_video_demo directory and create a new virtual environment
$ python3 -m venv venv $ source venv/bin/activate - Install the required packages
$ pip install -r requirements.txt - Run the .py file
$ python3 run.py